Even more about Social Security (SS part 2)
For some reason I’m still dicking around with Social Security. I went on a bit of a journey after writing the previous post. I hinted in that post that if you were FIRE curious that you probably weren’t going to be making major decisions based on the impact SS benefits. But I find it really difficult to support that conclusion so I’m probably wrong. So I tried writing a quick ruby script to see how long it would take me to hit the second bend point assuming similar income in future years as in previous years. Then I realized I’d completely ignored the inflation adjustments and my conclusions were almost certainly wrong. So at that point I felt like if I was going to do it I needed to do it right so I built out a Jupyter notebook. Doing that made me dig into details of the benefits calculation that I breezed through pretty fast in the last post. In the end I ended up with something that seems to work like the calculator on the SSA website but gives me more answers about the details.
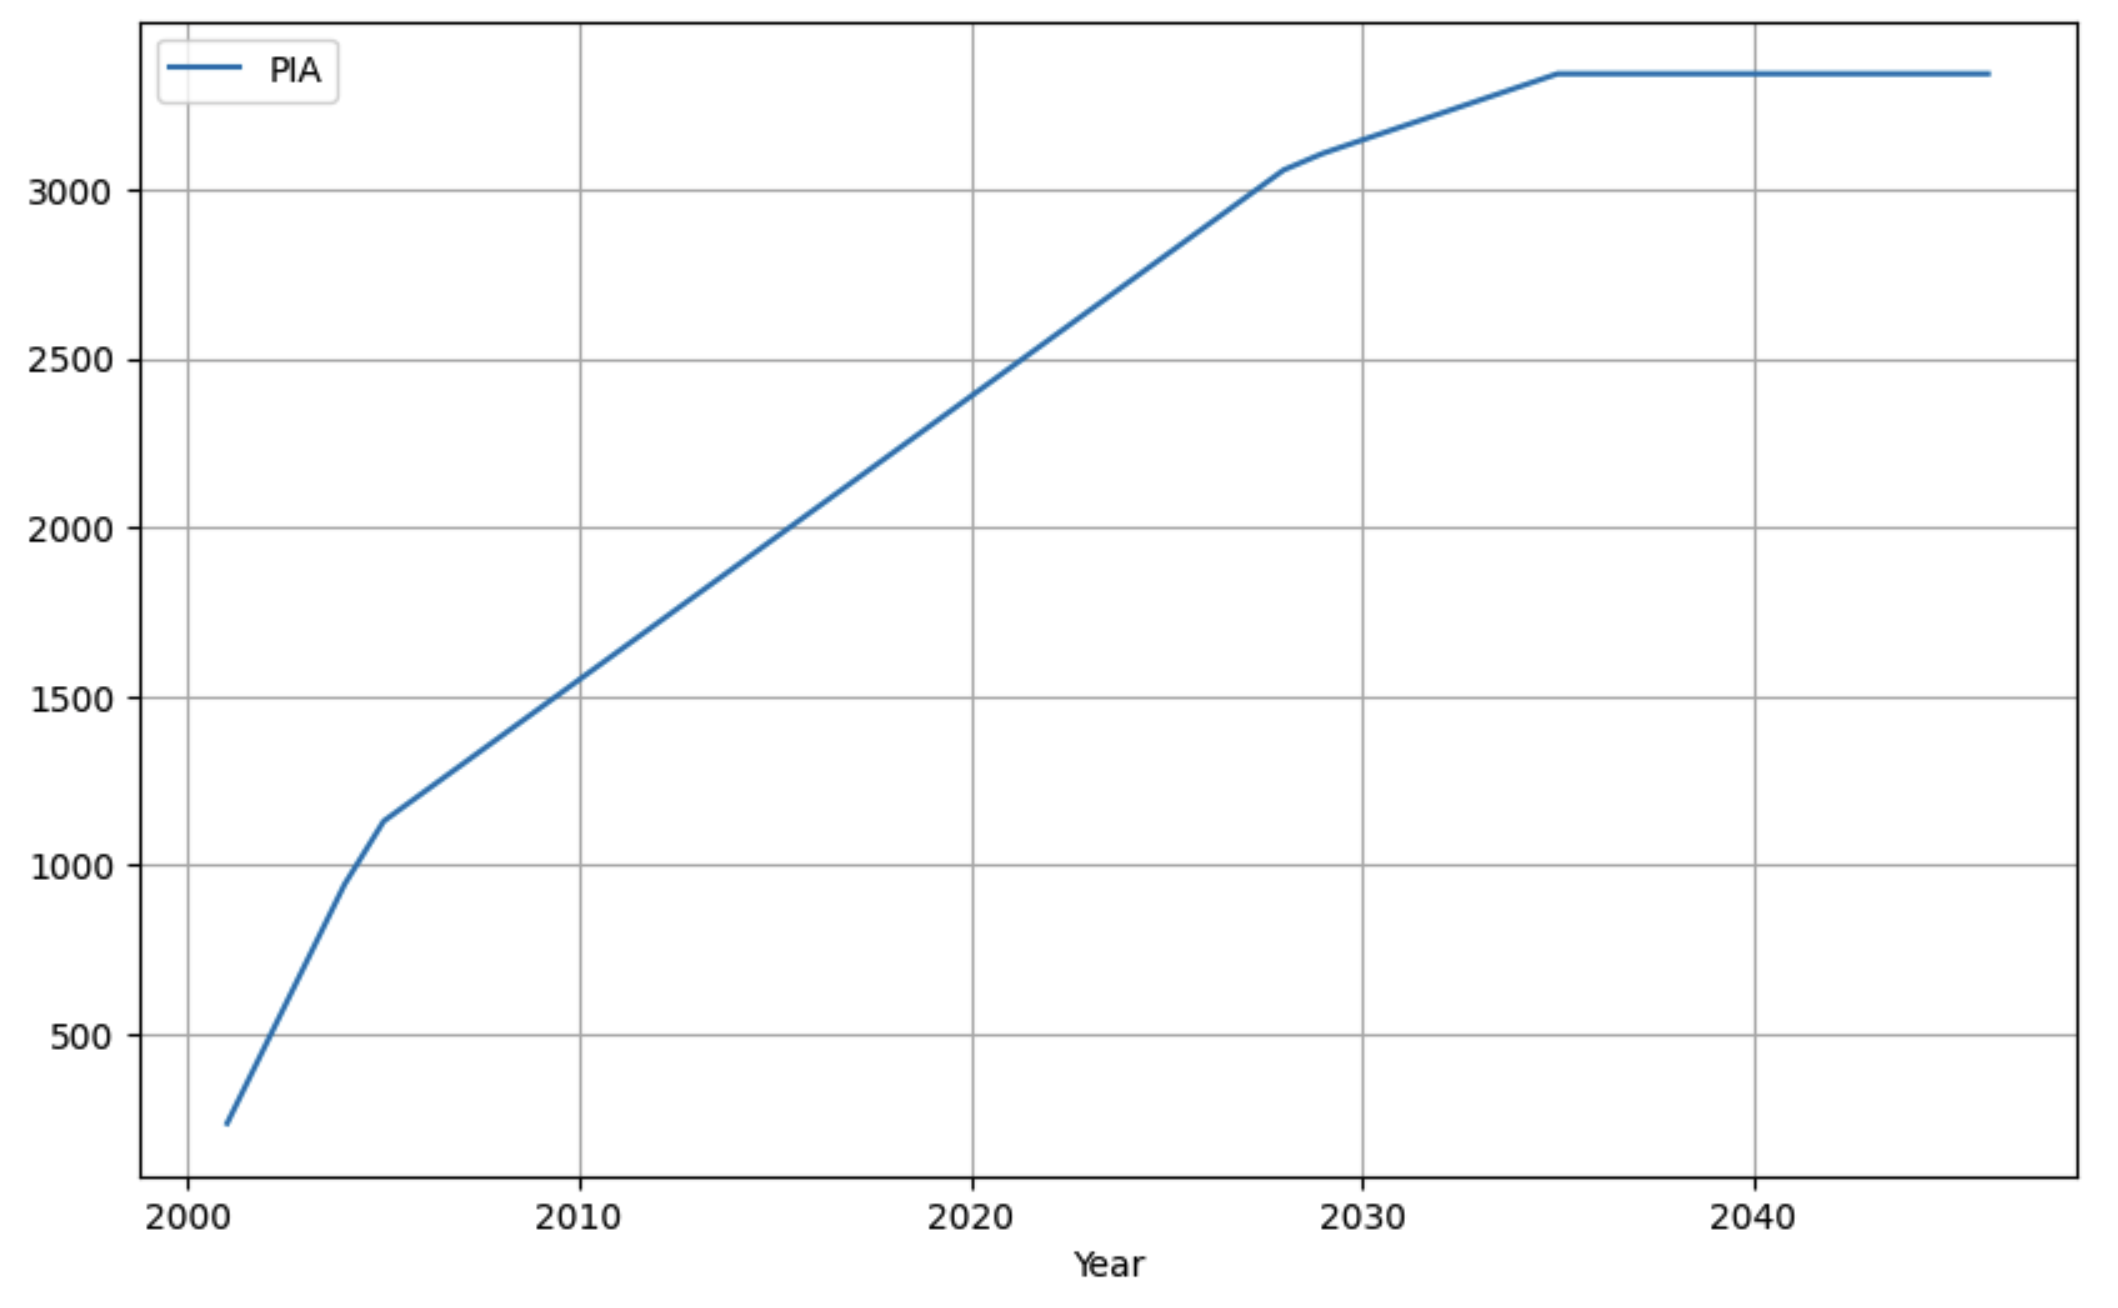
First a graph and table from the notebook. To make these I constructed some fake SS earnings records to show off data without sharing all of mine. What you see here the completely implausible journey of someone who started working in 2022 and made 110000 dollars adjusted to 2024 dollars every single year of their career. I tried slightly more realistic models but they didn’t illustrate the points I wanted to make any better and in fact just muddied it up. Ignore the NaN values in the table, I didn’t need to fill those in for future years. The indexed_earnings column is the one that matters, that’s the earnings for each year in 2024 dollars. We’ll talk about why they’re 2024 dollars when explaining how all of it works further below. PIA in the table and graph is the calculated SS benefits this person will get if they stop working forever in that year and then claim SS at age 67. (ignoring SS work credits as I did in the previous post. This person won’t actually be eligible to receive SS when they retire until 2011 when they’ve earned 40 credits. If they stop working forever in 2002 they get nothing at age 67).
| Year | Taxed Social Security Earnings | indexed_earnings | PIA |
|---|---|---|---|
| 2001 | 51848.09 | 110000.00 | 235.71 |
| 2002 | 52368.07 | 110000.01 | 471.43 |
| 2003 | 53648.22 | 109999.99 | 707.14 |
| 2004 | 56142.21 | 110000.01 | 942.86 |
| 2005 | 58196.46 | 109999.99 | 1130.13 |
| 2006 | 60871.35 | 110000.00 | 1213.94 |
| 2007 | 63633.80 | 110000.00 | 1297.75 |
| 2008 | 65097.64 | 110000.00 | 1381.56 |
| 2009 | 64115.92 | 110000.00 | 1465.37 |
| 2010 | 65631.30 | 110000.00 | 1549.18 |
| 2011 | 67687.75 | 110000.00 | 1632.98 |
| 2012 | 69801.33 | 110000.00 | 1716.79 |
| 2013 | 70693.49 | 110000.00 | 1800.60 |
| 2014 | 73202.84 | 110000.00 | 1884.41 |
| 2015 | 75749.59 | 109999.99 | 1968.22 |
| 2016 | 76605.57 | 110000.00 | 2052.03 |
| 2017 | 79250.96 | 110000.00 | 2135.84 |
| 2018 | 82123.40 | 110000.00 | 2219.65 |
| 2019 | 85201.02 | 110000.00 | 2303.46 |
| 2020 | 87608.40 | 110000.00 | 2387.27 |
| 2021 | 95398.50 | 110000.01 | 2471.08 |
| 2022 | 100469.71 | 110000.01 | 2554.89 |
| 2023 | 104921.37 | 110000.00 | 2638.70 |
| 2024 | 110000.00 | 110000.00 | 2722.51 |
| 2025 | NaN | 110000.00 | 2806.32 |
| 2026 | NaN | 110000.00 | 2890.13 |
| 2027 | NaN | 110000.00 | 2973.94 |
| 2028 | NaN | 110000.00 | 3057.75 |
| 2029 | NaN | 110000.00 | 3106.84 |
| 2030 | NaN | 110000.00 | 3146.12 |
| 2031 | NaN | 110000.00 | 3185.41 |
| 2032 | NaN | 110000.00 | 3224.69 |
| 2033 | NaN | 110000.00 | 3263.98 |
| 2034 | NaN | 110000.00 | 3303.26 |
| 2035 | NaN | 110000.00 | 3342.55 |
| 2036 | NaN | 110000.00 | 3342.55 |
| 2037 | NaN | 110000.00 | 3342.55 |
| 2038 | NaN | 110000.00 | 3342.55 |
| 2039 | NaN | 110000.00 | 3342.55 |
| 2040 | NaN | 110000.00 | 3342.55 |
| 2041 | NaN | 110000.00 | 3342.55 |
| 2042 | NaN | 110000.00 | 3342.55 |
| 2043 | NaN | 110000.00 | 3342.55 |
| 2044 | NaN | 110000.00 | 3342.55 |
| 2045 | NaN | 110000.00 | 3342.55 |
| 2046 | NaN | 110000.00 | 3342.55 |
There are three features to look at on the graph. Around 100k per year is the lowest number I could use and get all 3 of them to occur but I chose 110k because it makes a slightly more pleasing picture. The first two features are the SS bend points. The first one is at 2005, the second one in 2029. The third is a bonus off-brand bend point. Because the income past and future is a constant inflation adjusted 110000 dollars per year benefits stop growing as soon as the career is 35 years long. In this career that occurs in 2035.
At first glance the third bend might seem totally artificial but it can happen for real in a couple ways. One is that careers plateau so if that happens early enough for you you’ll see similar flattening. In fact if you’ve had a steady career you’ll probably see another flattening somewhere around 35 years in due to the effect of replacing the very early years where you were working part time around your high school classes with later years where you were making full time salary. As soon as you run out of 0 years and much lower earning years to replace with later higher earning years the graph flattens. Another point to note is that if you’re a high enough earner, the taxable earnings cap creates an artificial plateau in your earnings record. If you exceed the cap early enough in your career and keep exceeding it you’ll flatten out in the same way.
Some other interesting things to observe: firstly, as stated in the previous post, once you get to that second bend point you’ve already made 3/4 of the SS benefits it’s possible to make (the max in 2025 dollar is again about $4020). Also note how shallow the line has gotten, even if you are hitting the earnings cap in those years you cant make that line grow by more than about $60 a month in benefits for every additional year of working. This person is seeing $40 growth per year. Secondly, while it seemed going in that keeping the income steady from 22 on was totally nonsensical, and it is still is, it’s less so than I thought. Look at what the equivalent of 110k in 2024 was in 2001 (51848.09). That means a much larger part than I appreciated of the income growth that made me feel awesome over my career was actually just my salary keeping up with nationwide wage inflation. Thirdly, this person who is making a 75th percentile salary for the US (albeit from a very unlikely young age) and 66% of the taxable earnings cap has reached the top 25% of possible SS benefits by their late 40s and the maximum possible for their career in their mid-50s. Perhaps the unlikeliness of this career trajectory makes that a useless curiosity but I think it helps understand the shape of things.
What strategic conclusions to draw from all of this? I don’t know. It totally depends on your own unique situation. Which is why I’m sharing this notebook in hopes you’ll find it useful as a base for your own analysis in your own Jupyter install or even just to look at the code (and find my mistakes). I’m sorry that I didn’t do it as a spreadsheet. That would make it way more universally usable but I’m not willing to learn all the things I’d need to in order to do it as a spreadsheet.
If you just want to look at the calculations here’s the notebook rendered as html.
If you want the code instead it’s here and here’s the Average Wage Series which I’ll discuss below. You’ll also need to provide your earnings record, which I got by copying it off the SSA website and then manually fixing it (with perl) to turn it into TSV without commas, percent signs or dollar signs in the numbers.
The way this works, which seems like it’s probably pretty close to the way the SSA calculator works is:
- Go through your earnings record and index the earnings for inflation against the most recent year in the record. In the previous post I breezed past this so fast that I completely forgot about it when I wrote my initial ruby script. SS figures wage inflation with a dataset they keep called the Average Wage Index. If the most recent year in your record is 2024 and you want to index your earnings for 2021 what you do is divide the average wages in 2024 by the average wages in 2021. That gives you the wage inflation between 2021 and 2024 as a multiplier. You multiply your wages in 2021 by it. Do that for all the years in your earnings record.
- Add in future years. We assume we’ll make the same in all those years as we did in 2024 (or the cap).
- Then calculate the average indexed monthly earnings (AIME) for every year. That’s the earnings for that year plus the previous 34 or as many previous years as there are, divided by 35, divided by 12 to make it monthly.
- Take AIME for each year and calculate SS full retirement benefits (PIA) using the bend points as described in the previous post. We use the bend points for this year.
A key point to note: By using todays bend points and a constant amount for the earnings in each future year we’re ignoring future inflation while accounting for past inflation by doing that indexing. That means the answers come out in today dollars. Which is good because I know how to reason about them. In 2046 the actual benefits will be different because all the earnings will be adjusted to 2044 average wages, not 2024 and we expect the bend points and earnings caps to be updated upwards each year as well. But we expect that the 2046 numbers will be the same as the 2024 numbers I’m estimating, just adjusted upwards for wage inflation.
This notebook doesn’t give me the exact same answers as the ssa.gov calculator but the answers are within a couple percent and which makes me think that there’s just one or two minor nuances I’ve missed, maybe just off by one errors in which years are used for which parts of the calculation. Whatever the errors are they don’t seem to compound. If you find them please let me know.